Native macOS 14+ · Swift

See what your Mac is really doing

A fast, local process monitor for Apple Silicon and Intel: live system activity, a parent–child tree, rich per-process inspectors, optional menu bar monitoring, and Shortcuts-friendly automation—nothing leaves your Mac for monitoring.

Download for Mac Version 1.1 (25)

macOS 14+ · Apple Silicon & Intel

Process Doctor main window with live system charts and process tree
Main window: live system charts and process tree.

Core experience

Everything below runs on your Mac using native APIs—no remote dashboard and no cloud process list.

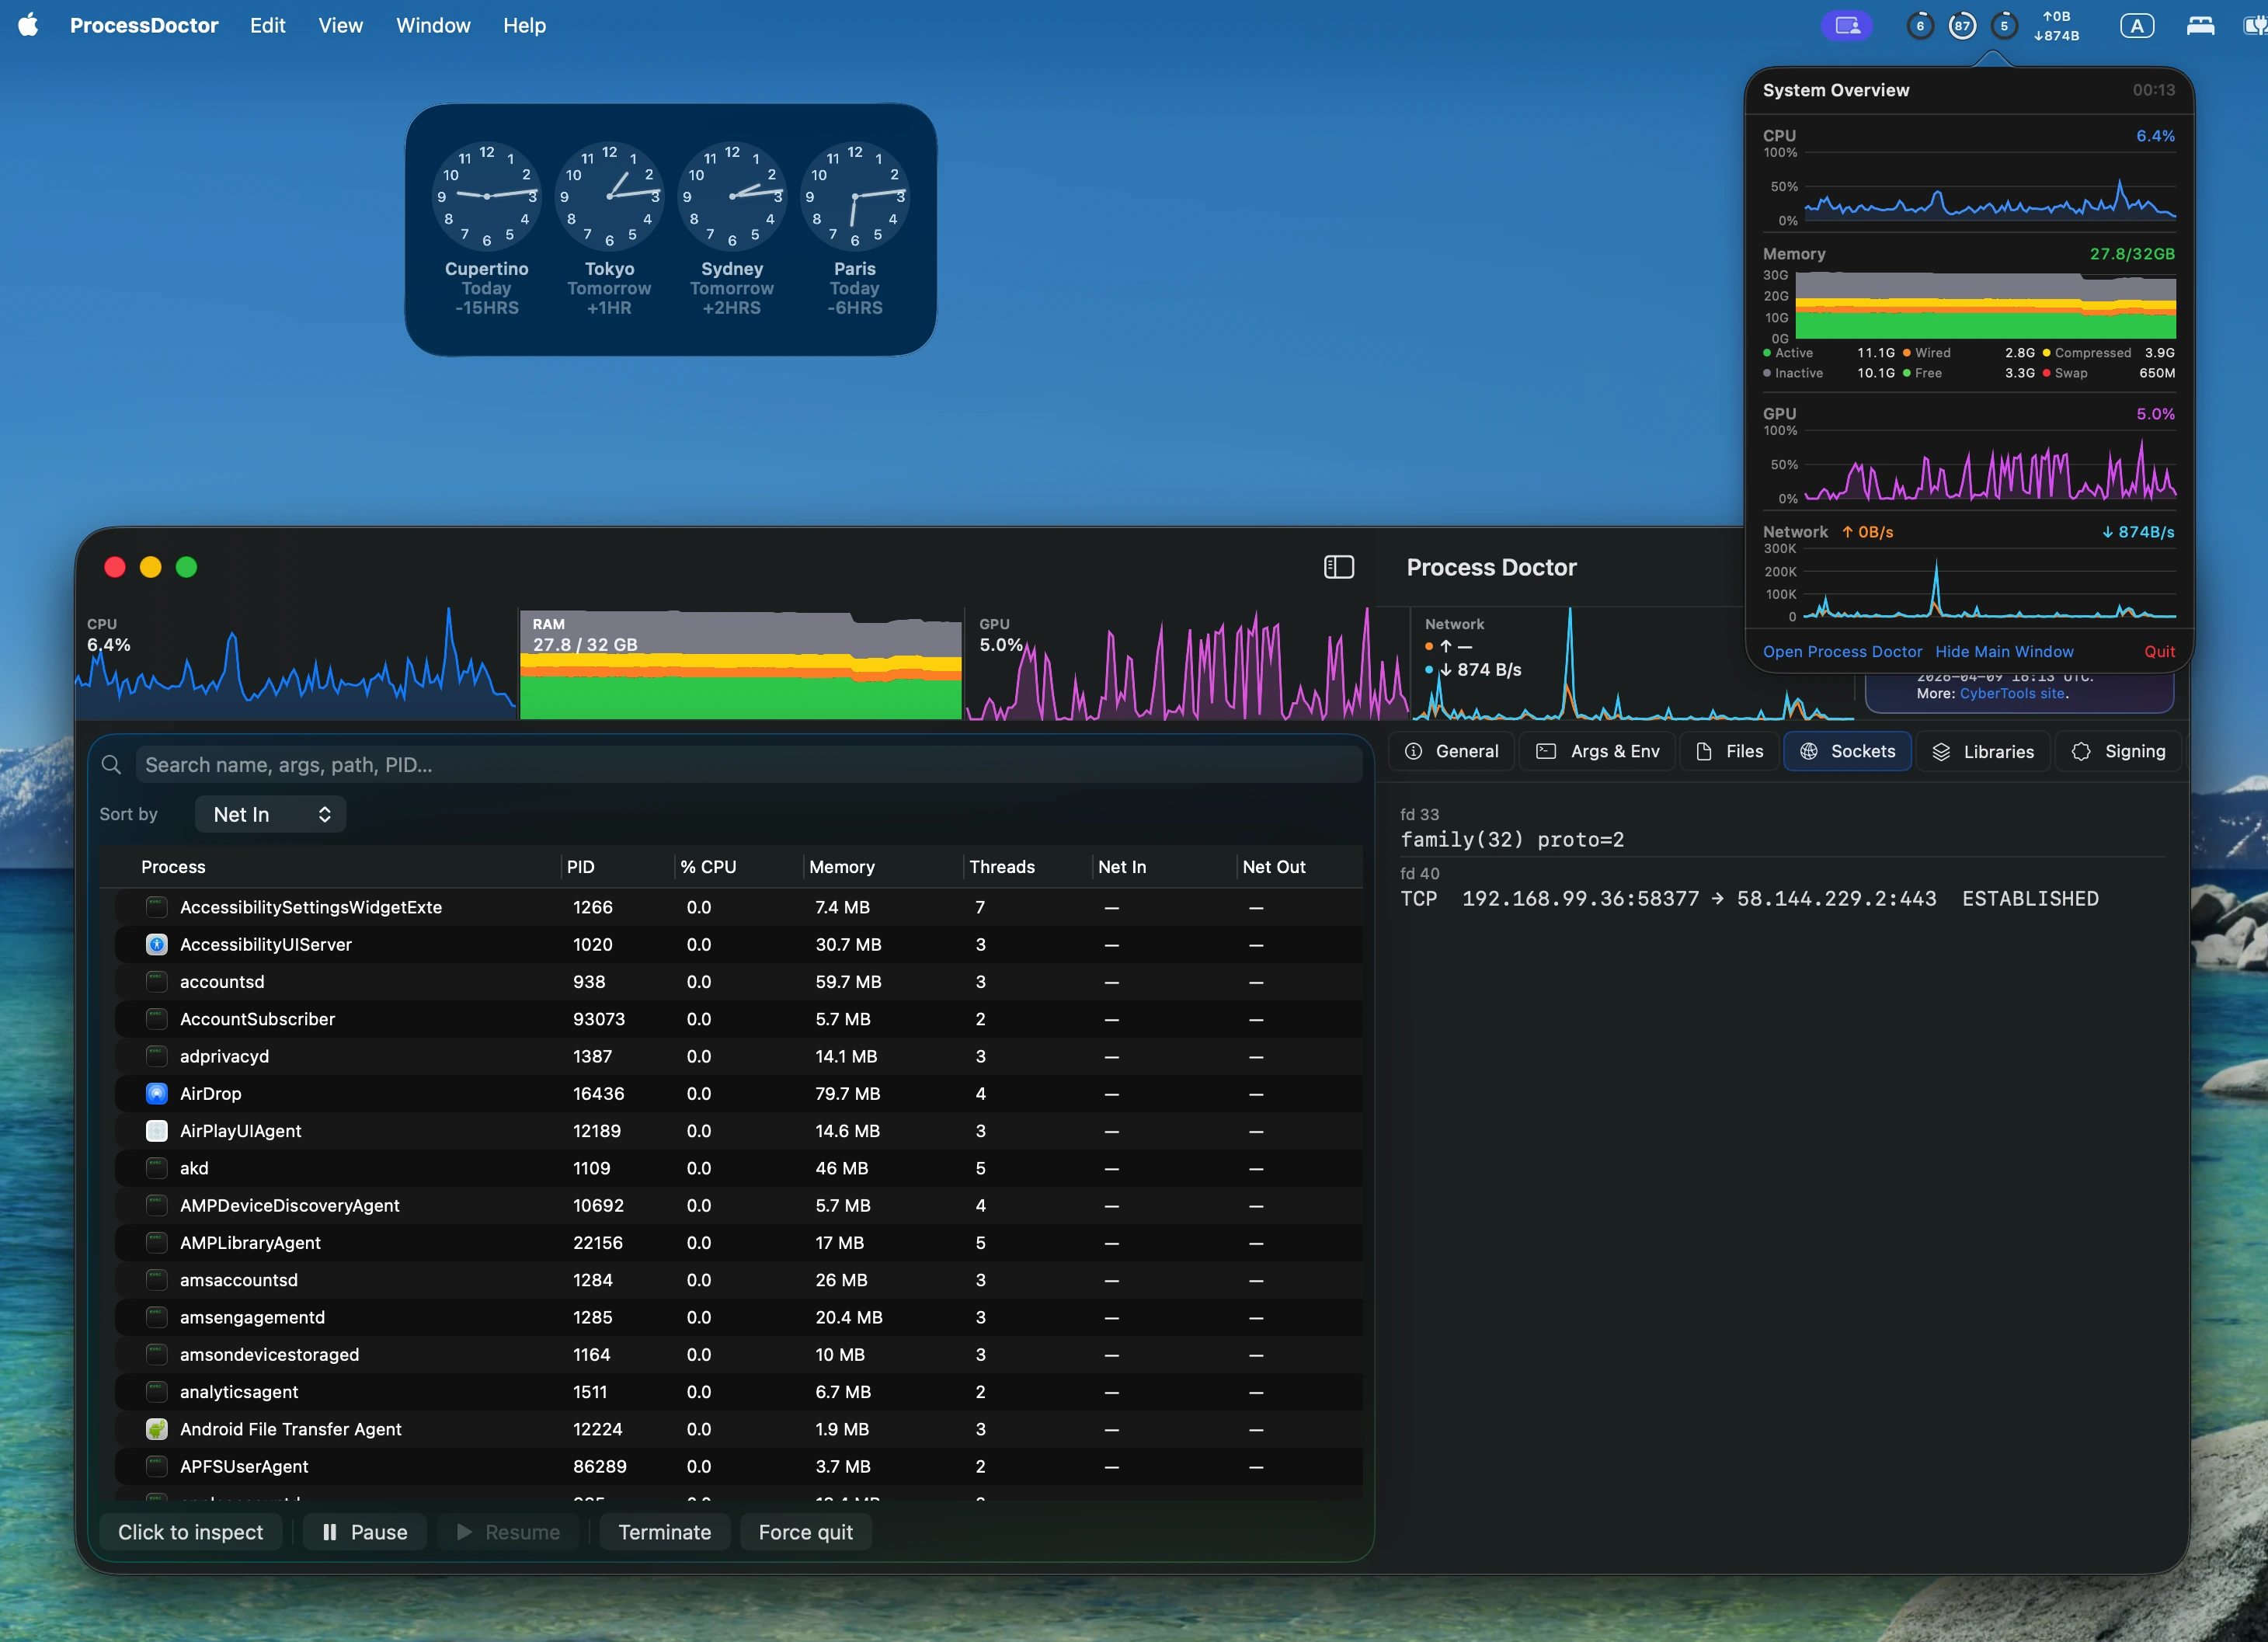
Live system overview

CPU, memory (including pressure-style breakdown), GPU utilization, and network throughput as sparkline charts in the main window—always visible above the process list. Network uses the default-route interface when available; otherwise rates are aggregated from processes.

Configurable sampling

Adjust refresh interval (down to half-second steps) and how many history samples to retain for charts and trends.

Menu bar companion

Optional menu bar item with system charts and quick actions to open the app or hide the main window—ideal for always-on monitoring.

Tree, search & sort

Hierarchical outline with search across name, arguments, path, and PID. Sort by CPU, memory footprint, threads, network in/out, name, or PID. Optional ancestor-aware filtering: show matches plus their parent chain.

Click to inspect

Pick a window under the cursor to jump to its process. Uses Accessibility when allowed; falls back to window geometry when not.

Process actions

Pause (SIGSTOP), resume (SIGCONT), terminate, or force quit selected processes—with confirmations where it matters.

Shortcuts automation

Fire Shortcuts when processes start or exit: JSON is copied to the clipboard and your shortcut is opened via the Shortcuts URL scheme.

Per-process inspectors

Select any process to open a detail pane with tabbed inspectors—footprint-oriented memory detail, networking, signing, startup items, and more.

General Args & environment Open files Sockets Libraries Code signing Entitlements Startup items History charts

General includes footprint-oriented memory breakdown (physical footprint, compressed, internal, purgeable, and related fields where available). Libraries can use otool when enabled in Settings.

Launch, presentation & updates

Launch & presentation

Open at login, menu-bar-only behavior after login, optional always menu-bar-only, Dock icon visibility, and whether the main window opens at launch—tuned for both desktop and background monitoring.

Updates

Check for updates from Settings or the Help menu. The app can also check automatically on launch and about once per day while running (you’re only alerted when a newer version is available).

Permissions

  • Accessibility Required for click-to-inspect. You can still use geometry-based picking without it.
  • Full Disk Access Optional—helps the deepest plist scans and some paths. Add Process Doctor under Privacy & Security → Full Disk Access if you want that depth.